Overview
The primary objective of this article is to serve as a comprehensive guide for effectively interpreting chromatography column diagrams. It delineates essential steps, including:
- A thorough examination of the diagram
- Identification of key components
- Analysis of retention times
- Troubleshooting common challenges
By doing so, it equips readers with the critical skills necessary to enhance their analytical accuracy in chromatography. Understanding these elements is fundamental for any professional aiming to excel in this field.
Introduction
Navigating the complexities of chromatography presents a significant challenge, particularly when confronted with the intricate diagrams that illustrate this essential analytical technique. Understanding how to interpret chromatography column diagrams transcends mere academic exercise; it is a vital skill for scientists and researchers dedicated to effectively separating and analyzing mixtures. This guide explores the essential steps and key components that facilitate accurate interpretation, empowering readers to enhance their analytical capabilities. Yet, amidst the wealth of information, one must consider: how can common challenges—such as overlapping peaks or irregular shapes that often obscure the clarity of results—be effectively overcome?
Understand the Basics of Chromatography
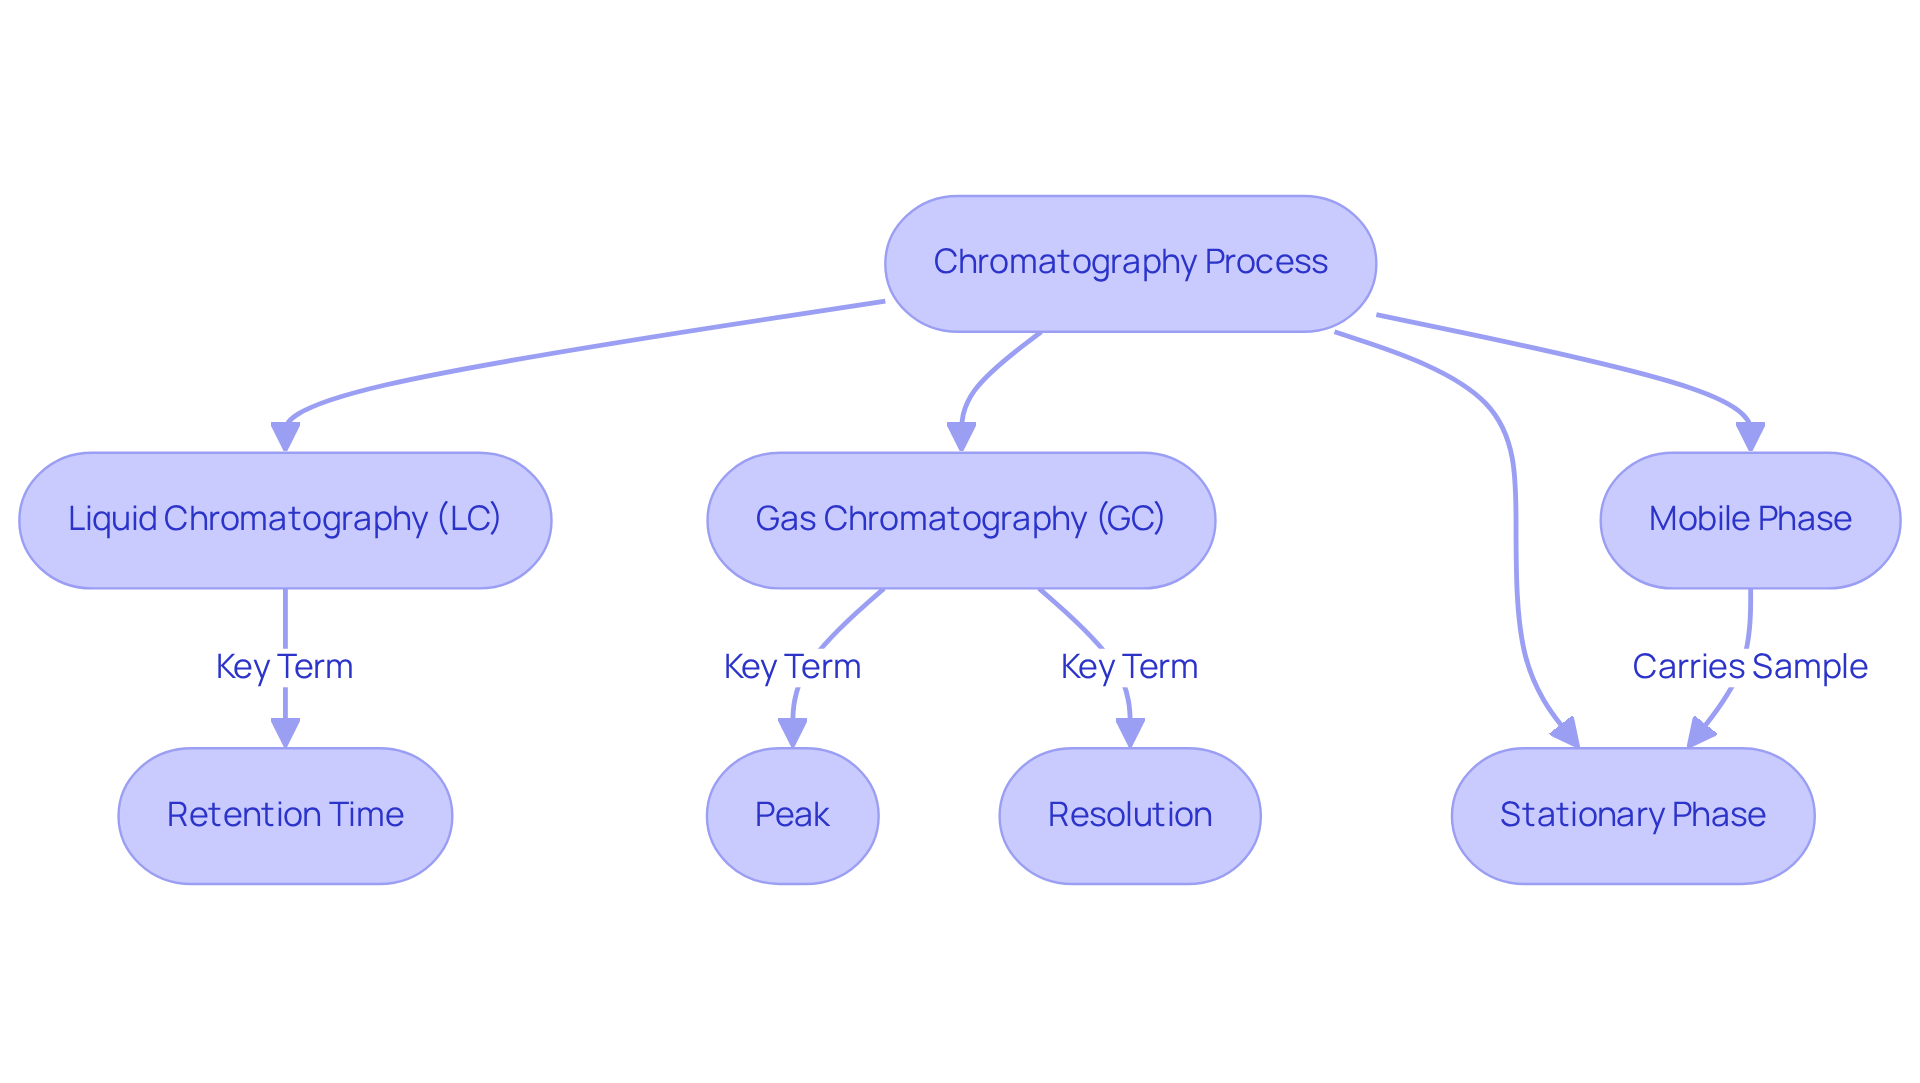
The chromatography column diagram demonstrates how chromatography serves as an essential method for dividing mixtures into their distinct elements, based on the interactions between a stationary substance and a moving substance. The mobile medium, typically a solvent, carries the sample through the tube, while the stationary material, composed of substances packed inside the tube, interacts with the sample elements to facilitate separation.
Understanding the distinctions between various , such as liquid chromatography (LC) and gas chromatography (GC), is crucial for effective application in laboratory settings. Each type offers unique methods of separation and specific applications, significantly influencing the interpretation of chromatography column diagrams.
Key terms like retention time, peak, and resolution are vital for grasping the results and will be referenced throughout this guide. Familiarity with these concepts not only enhances analytical skills but also supports accurate data interpretation in practical scenarios.

Identify Key Components of Chromatography Column Diagrams
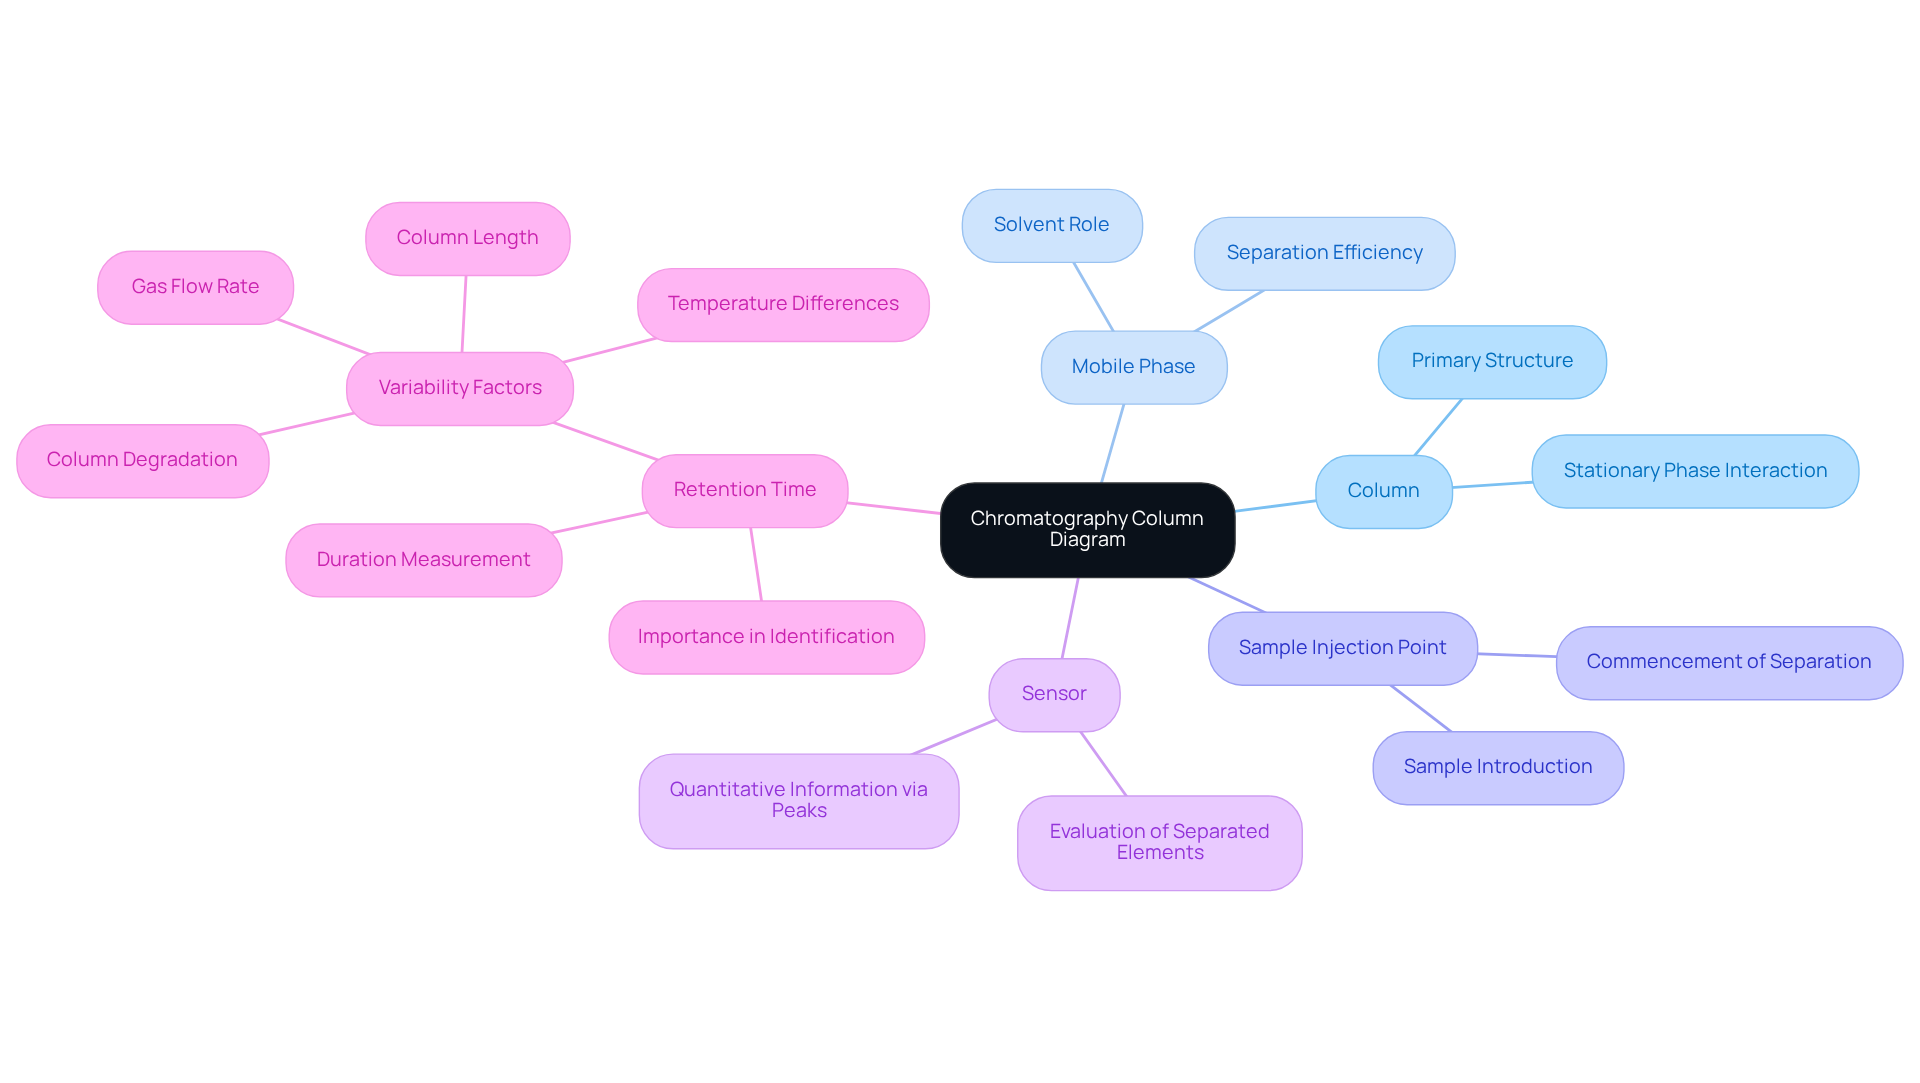
A typical chromatography column diagram includes several essential components that are critical for understanding the separation process.
- Column: This primary structure serves as the site of separation, typically filled with a stationary phase that interacts with the sample components.
- Mobile Phase: The solvent that traverses the tube, transporting the sample, plays a pivotal role in separation efficiency.
- Sample Injection Point: Here, the sample is introduced into the mobile phase, marking the commencement of the separation process.
- Sensor: Positioned at the end of the vertical section, the sensor evaluates the separated elements as they elute, often illustrated by peaks in a chromatogram, providing quantitative information.
- Retention Time: This crucial metric indicates the duration required for a substance to traverse the column to the detector. Understanding is vital for identifying elements and ensuring precise analysis. Comparisons of retention time are particularly important for recognizing elements within complex mixtures, as variability can arise from factors such as gas flow rate and temperature differences.
Familiarity with these components not only aids in interpreting chromatography column diagrams but also enhances overall analytical skills within pharmaceutical laboratories, where accuracy and reliability are paramount. Moreover, comprehending the significance of retention time in qualitative analysis is essential for effective chromatographic practices, especially in pharmaceutical applications.

Follow Steps to Interpret Chromatography Column Diagrams
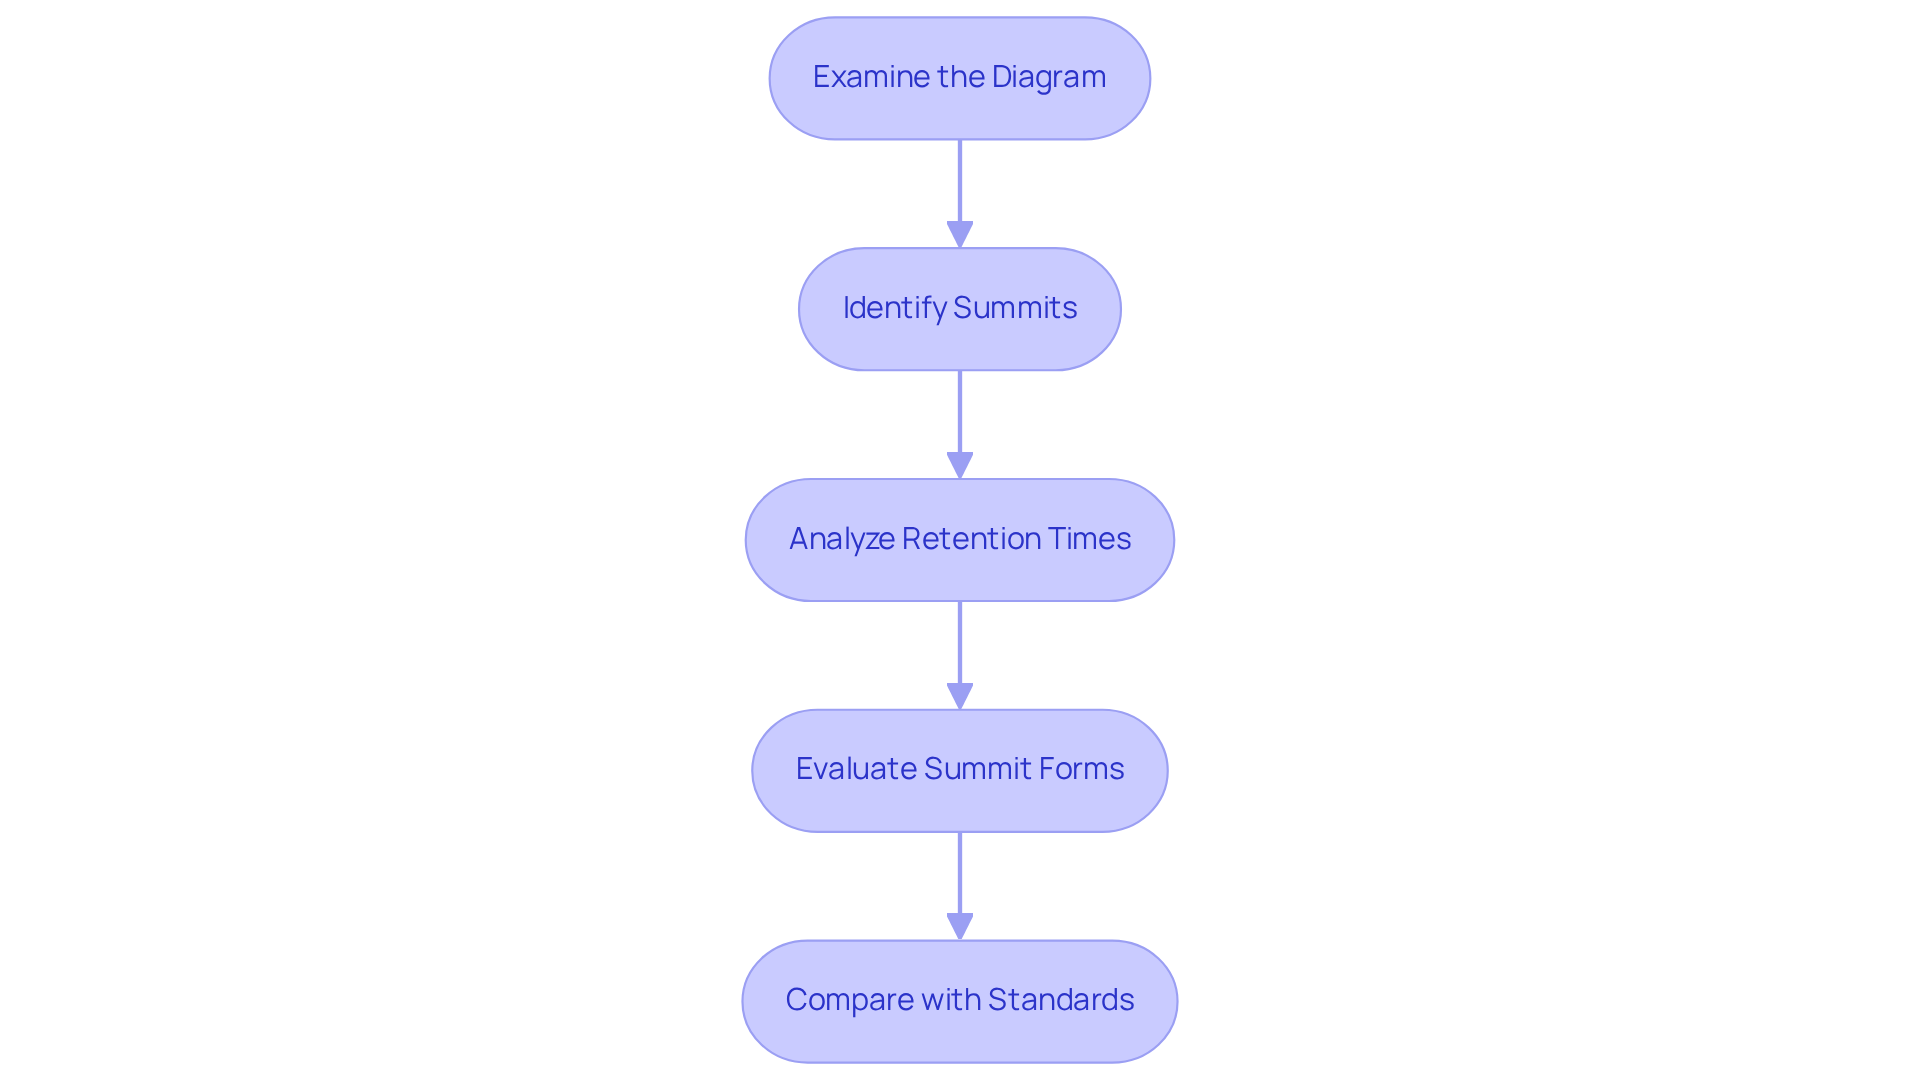
To effectively interpret chromatography column diagrams, follow these essential steps:
- Examine the Diagram: Begin by analyzing the overall layout, identifying key elements such as the column, mobile phase, and detector. This initial assessment sets the foundation for a comprehensive understanding of the chromatographic process as illustrated in the chromatography column diagram.
- Identify Summits: Locate the summits within the chromatogram. Each summit represents a unique element of the sample, with the frequency of overlapping summits often suggesting possible problems in separation. As noted by chromatography specialist M.C. Pietrogrande, the essence of the statistical degree of overlapping (SDO) is vital for comprehending the anticipated quantities of singlet, doublet, and triplet signals according to the number of elements.
- Analyze Retention Times: Document the retention times linked with each summit. This data is essential for determining the identity of the components, as it can be compared against . For instance, the lower limit of quantification (LLOQ) for various compounds can vary significantly, such as the LLOQ for E2 being set at 0.05 ng/mL, which can influence retention time evaluations.
- Evaluate Summit Forms: Assess the shape of each summit. Ideally, sharp and symmetrical summits signify effective separation, while broad or split formations may indicate issues such as column overload or poor resolution. As highlighted by chromatography experts, examining shape profiles is crucial for comprehending retention time dynamics and ensuring precise results.
- Compare with Standards: If accessible, contrast your results with standard chromatograms to confirm the identity of the substances. This comparison is essential for guaranteeing precise analysis and can assist in recognizing discrepancies in retention durations or shape profiles. A real-world example includes the chromatographic separation of polychlorinated biphenyls, which illustrates the practical application of these analysis techniques.
By following these steps, you can significantly enhance your understanding of the chromatography column diagram and the resulting chromatography results, leading to more precise and reliable analyses.

Troubleshoot Common Interpretation Challenges
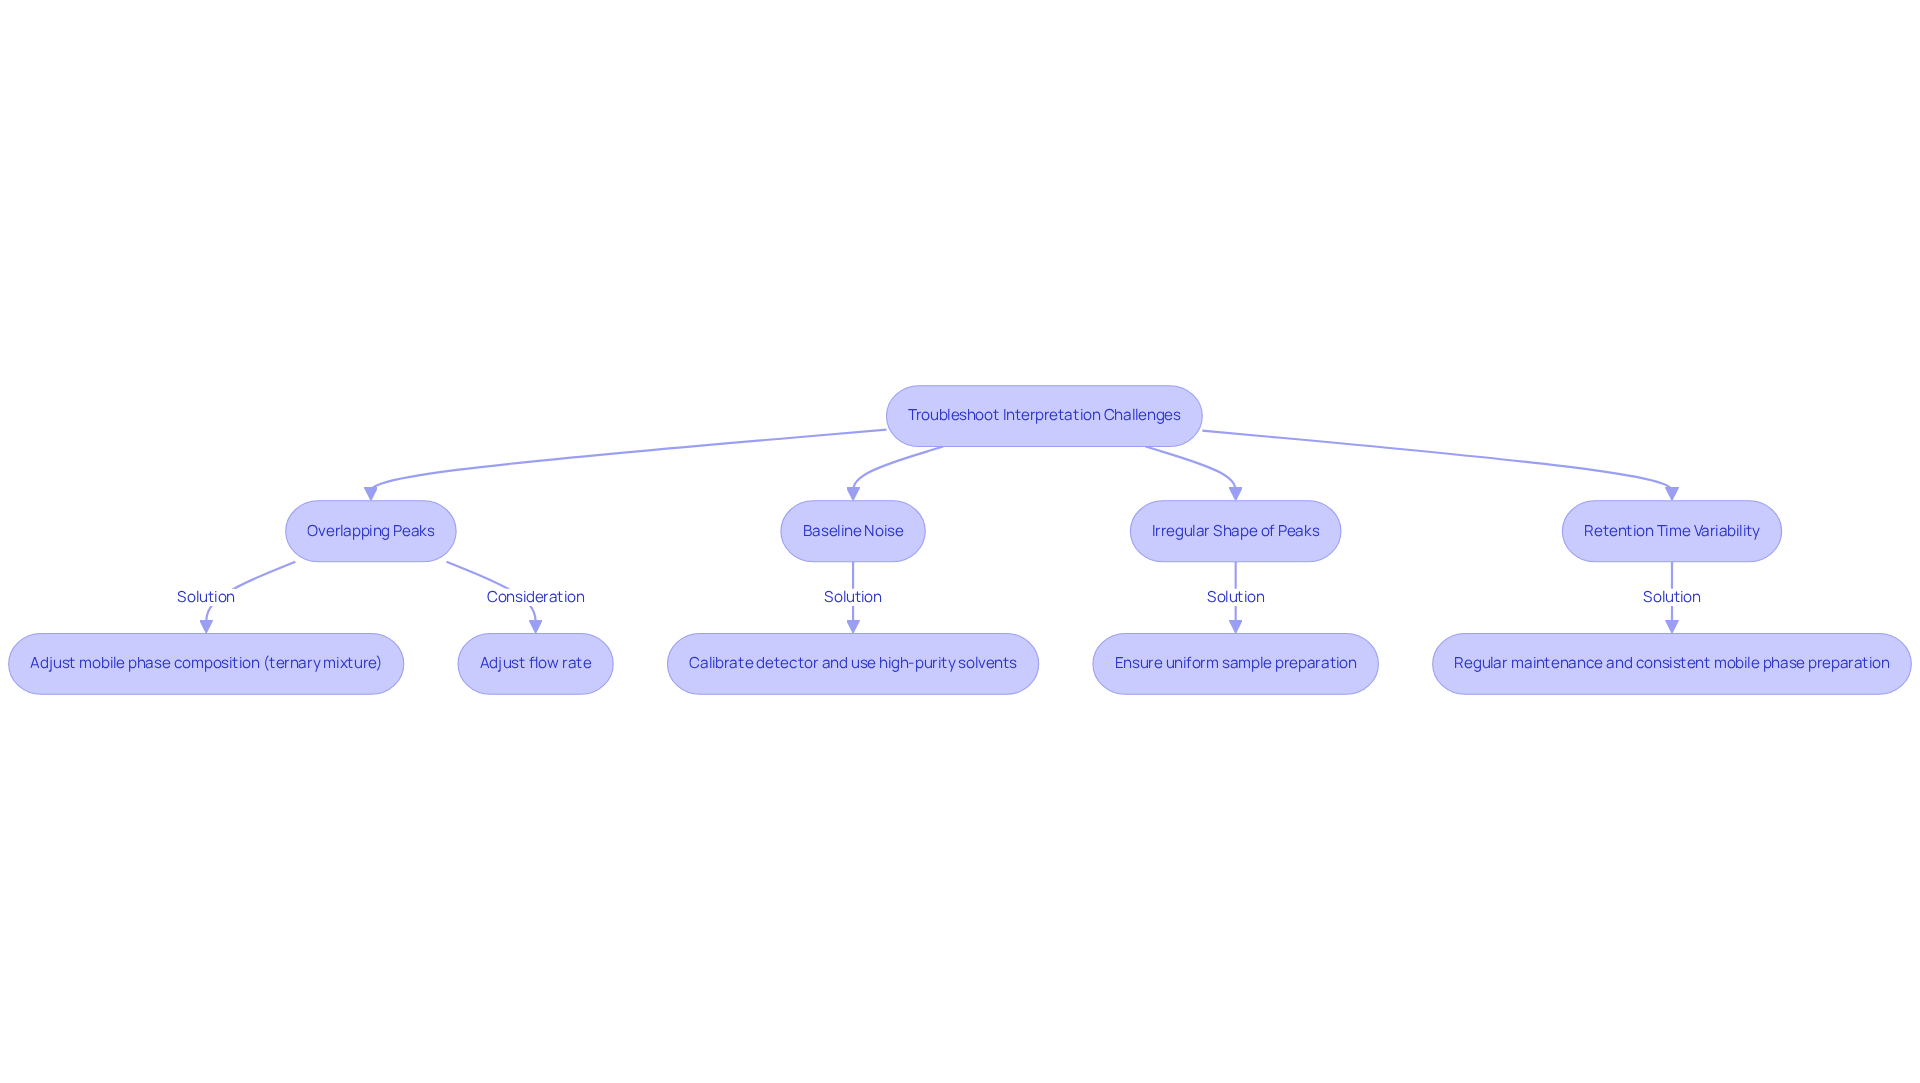
Interpreting chromatography column diagrams presents several common challenges that require attention to detail and expertise:
- Overlapping Peaks: The presence of overlapping peaks can significantly complicate the identification of individual components. To enhance separation, is crucial. Consider incorporating a ternary mixture of acetonitrile, water, and ethyl acetate, as this has been shown to significantly improve the resolution of the signals. Furthermore, adjusting the flow rate can assist in differentiating closely eluting signals, thereby enhancing analytical clarity.
- Baseline Noise: Variations in the baseline can hinder optimal detection, making it challenging to achieve precise results. To address this issue, ensure that the detector is properly calibrated and that the mobile phase is free from contaminants. Implementing thorough degassing and maintaining a stable laboratory temperature, along with using high-purity solvents, can further reduce baseline noise and drift, leading to more reliable outcomes.
- Irregular Shape of Peaks: Unusual peak shapes frequently indicate hidden problems with the support or sample preparation. It is essential to examine the support for any obstructions or impurities and ensure that samples are prepared uniformly. Adhering to flushing protocols and substituting worn elements can assist in sustaining optimal performance and enhancing peak shape, which is vital for accurate analysis.
- Retention Time Variability: Notable fluctuations in retention times may signal alterations in mobile composition or column conditions. Regular maintenance, including consistent preparation of mobile phases and servicing of pumps, is essential to mitigate these issues. By ensuring reliability in analytical results, one can maintain the integrity of the chromatography process.

Conclusion
Mastering the interpretation of chromatography column diagrams is essential for anyone engaged in analytical chemistry. This guide has underscored the fundamental principles of chromatography, highlighting the interaction between mobile and stationary phases that enables the separation of mixtures. A comprehensive understanding of the core components and their functions within these diagrams lays the groundwork for accurate analysis and interpretation.
Key insights covered include the critical importance of identifying the various parts of a chromatography column, such as:
- The column itself
- Mobile phase
- Sample injection point
- Sensor
Furthermore, the guide detailed essential steps for interpreting the diagrams, from examining the overall layout to analyzing retention times and comparing results with known standards. Recognizing common challenges, such as overlapping peaks and baseline noise, is crucial for troubleshooting and ensuring reliable outcomes.
For those looking to enhance their analytical capabilities, embracing these interpretation steps is vital. By applying the knowledge and techniques discussed, individuals can significantly improve their understanding of chromatography and its applications across various fields, including pharmaceuticals and environmental analysis. Engaging with chromatography not only refines analytical skills but also contributes to the advancement of research and quality control practices.


