Overview
This article delves into the essential understanding of chromatography diagrams, emphasizing their definition and key components, which are crucial for interpreting the separation of mixture components in analytical chemistry. Each peak in a chromatogram signifies a distinct substance, with the area beneath the peak representing its concentration. This underscores the diagram's vital role across various fields, including pharmaceuticals and environmental testing. By grasping these concepts, readers can appreciate the significance of high-quality scientific instruments in laboratory settings, ultimately enhancing their analytical capabilities.
Introduction
Chromatography diagrams, or chromatograms, are indispensable tools in analytical chemistry, serving as visual representations of the separation of components within mixtures. By converting intricate data into accessible graphical formats, these diagrams empower scientists across diverse fields—from pharmaceuticals to environmental testing—to derive crucial insights into sample compositions. Yet, a pressing challenge persists: how can researchers guarantee the accuracy and reliability of these representations amid the complexities of modern analytical techniques? Mastering the intricacies of chromatography diagrams is vital for traversing this landscape and fully leveraging their potential in scientific analysis.
Define Chromatography Diagram
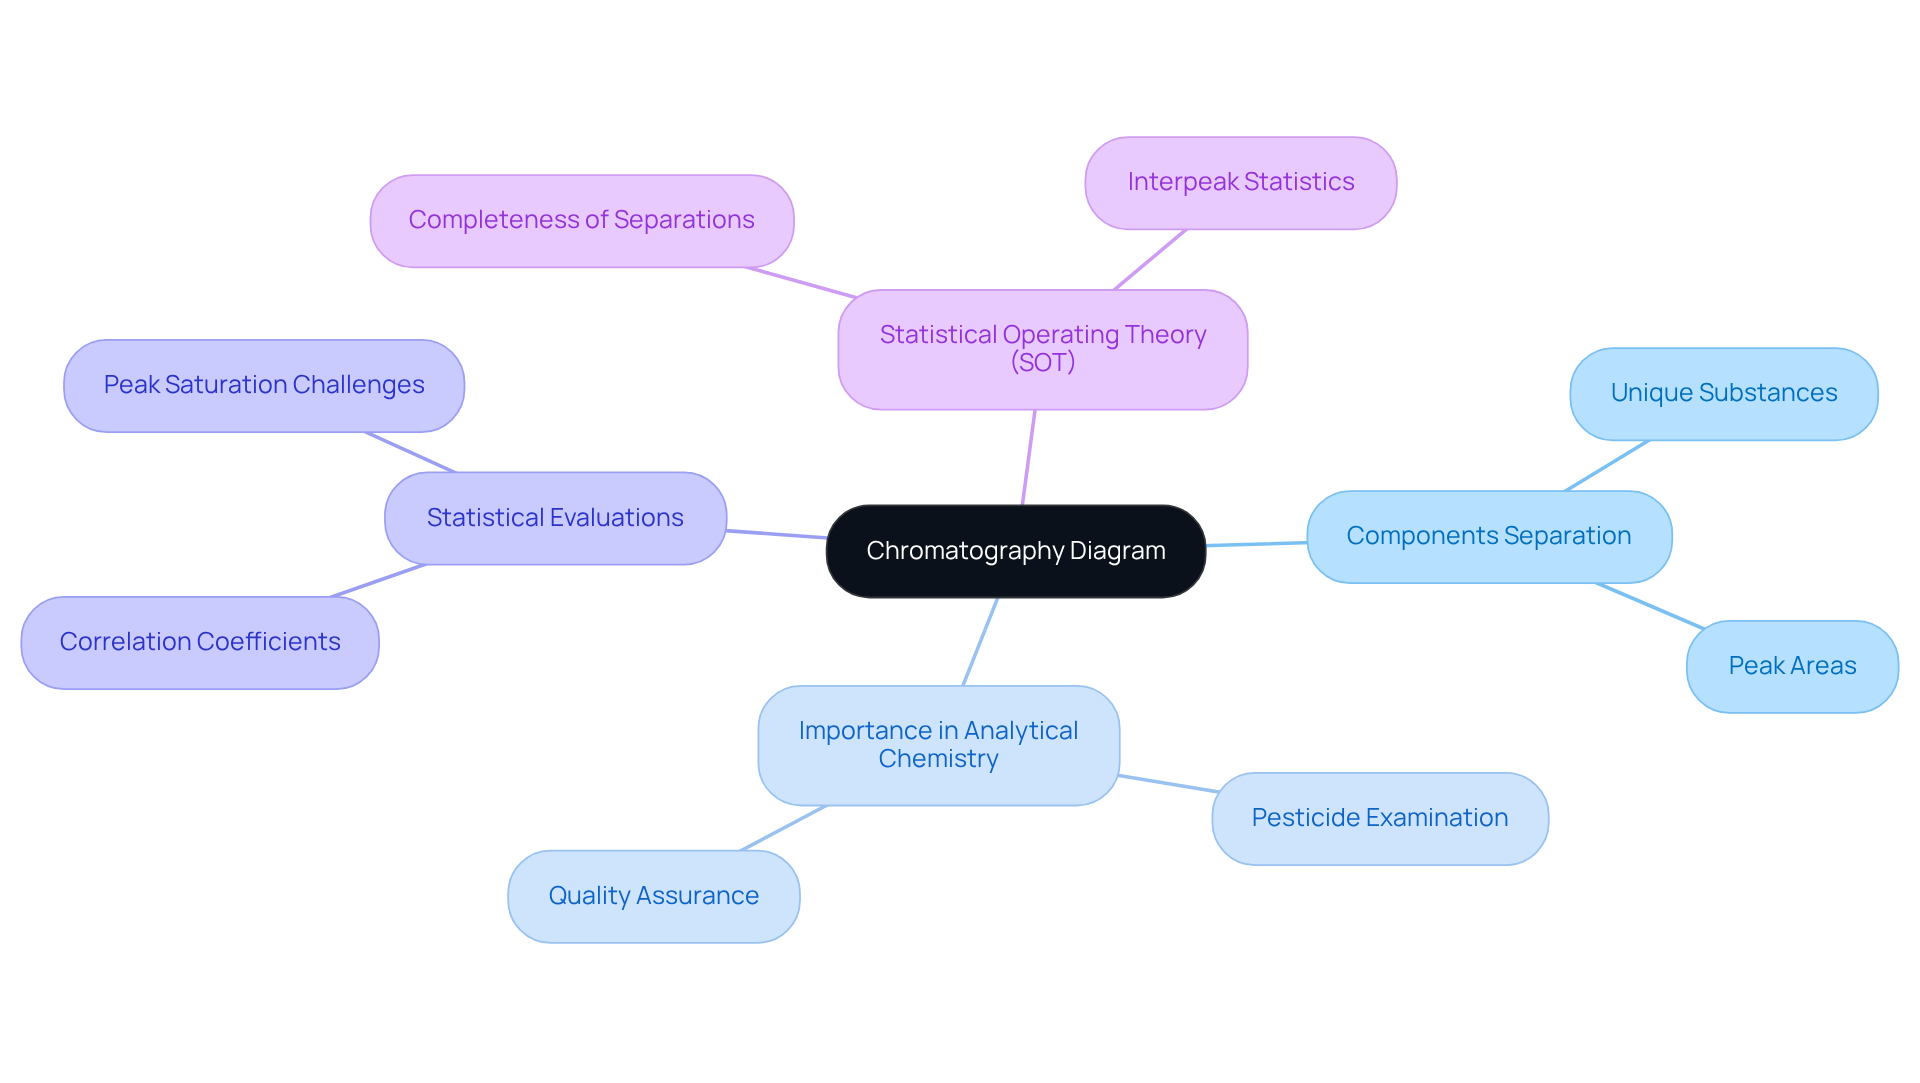
A chromatography diagram, often referred to as a chromatogram, serves as a graphical representation of the separation of components within a mixture as they traverse a stationary phase, propelled by a mobile phase. Each peak in the diagram corresponds to a unique substance, with the area beneath each peak reflecting the concentration of that component.
In 2025, the importance of chromatograms in analytical chemistry is underscored by their critical role in providing insights into the composition and behavior of samples. For instance, in pesticide examination, chromatograms are essential for measuring residues, ensuring compliance with safety regulations.
Furthermore, statistical evaluations of chromatograms reveal that a typical random chromatogram may include only about 37% of its potential signals, highlighting the necessity for precise methodologies in laboratory environments. This statistic emphasizes the challenges of peak saturation, which can result in the loss of unique identification in single-channel detectors.
Understanding these chromatography diagrams is vital for interpreting chromatographic outcomes, making them indispensable tools in both research and quality assurance across various scientific domains. Additionally, the concept of Statistical Operating Theory (SOT) offers valuable insights into the completeness of separations in chromatograms, further enhancing the comprehension of chromatographic analysis.

Contextualize the Role of Chromatography Diagrams in Analytical Chemistry
Chromatography diagrams play a pivotal role in analytical chemistry, enabling scientists to visualize and interpret the separation of complex mixtures. These essential tools find applications across various fields, including pharmaceuticals, environmental testing, and food safety.
For example, in pharmaceutical development, chromatograms are crucial for ensuring the purity of compounds and monitoring reaction progress. The ability to quickly evaluate a sample's composition using a chromatography diagram enables timely decision-making and quality assurance in laboratory environments.
Moreover, this analytical technique is vital for drug formulation and quality assurance, ensuring compliance with safety and efficacy standards set by regulatory bodies like the FDA and EMA.
In the realm of environmental assessment, separation charts play a critical role in examining pollutants and contaminants in air, water, and soil samples, thereby ensuring adherence to safety standards and supporting public health.
The current trend towards high-resolution methods, such as Ultra-Performance Liquid Chromatography (UPLC), enhances the efficiency of these representations, allowing for more precise analysis and reinforcing quality assurance in both pharmaceuticals and environmental science.
Trace the Historical Development of Chromatography Diagrams
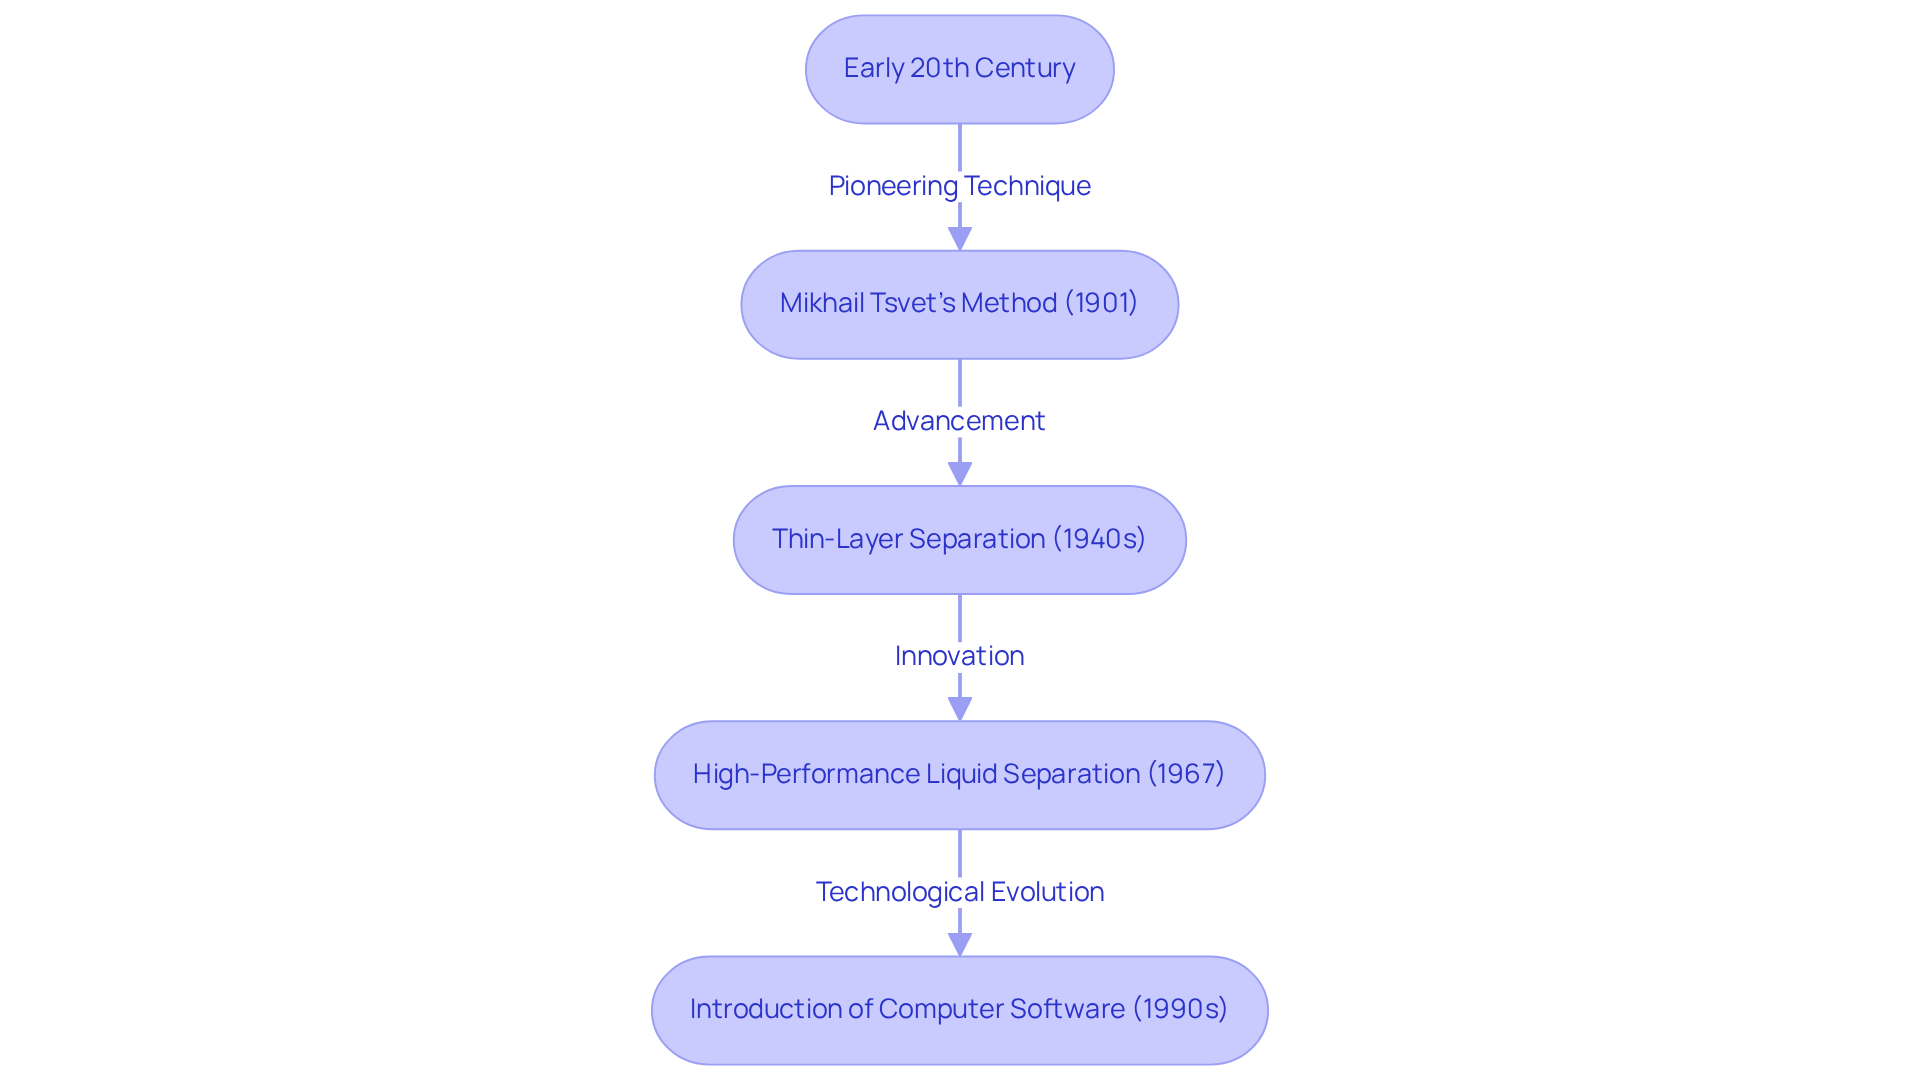
The development of separation illustrations can be traced back to the early 20th century, initiated by Russian botanist Mikhail Tsvet, who pioneered the method for distinguishing plant pigments. Initially, this separation technique was rudimentary; however, it underwent substantial enhancements with the advent of methods such as thin-layer separation and high-performance liquid separation, which celebrated its 50th anniversary in 2016. These innovations not only advanced separation capabilities but also increased the complexity and utility of chromatography diagrams, making them indispensable for interpreting results from more sophisticated evaluations.
The emergence of computer software for data analysis marked a pivotal moment, revolutionizing the creation and interpretation of chromatograms. This technological evolution has rendered chromatographic data more accessible and informative, empowering researchers to extract meaningful insights from their analyses.
Over the years, the evolution of chromatography diagrams has paralleled advancements in separation techniques, reflecting the ongoing development of analytical methods in scientific research. Notably, the contributions of Archer Martin and Richard Synge, who were awarded the Nobel Prize in Chemistry in 1952 for their work on partition separation, underscore the importance of these advancements. Furthermore, the introduction of capillary columns by Marcel Golay significantly enhanced chromatographic efficiency, bolstering overall analytical capabilities. The role of chromatography in food safety analysis further illustrates its practical applications and significance in contemporary scientific research.

Identify Key Components of Chromatography Diagrams
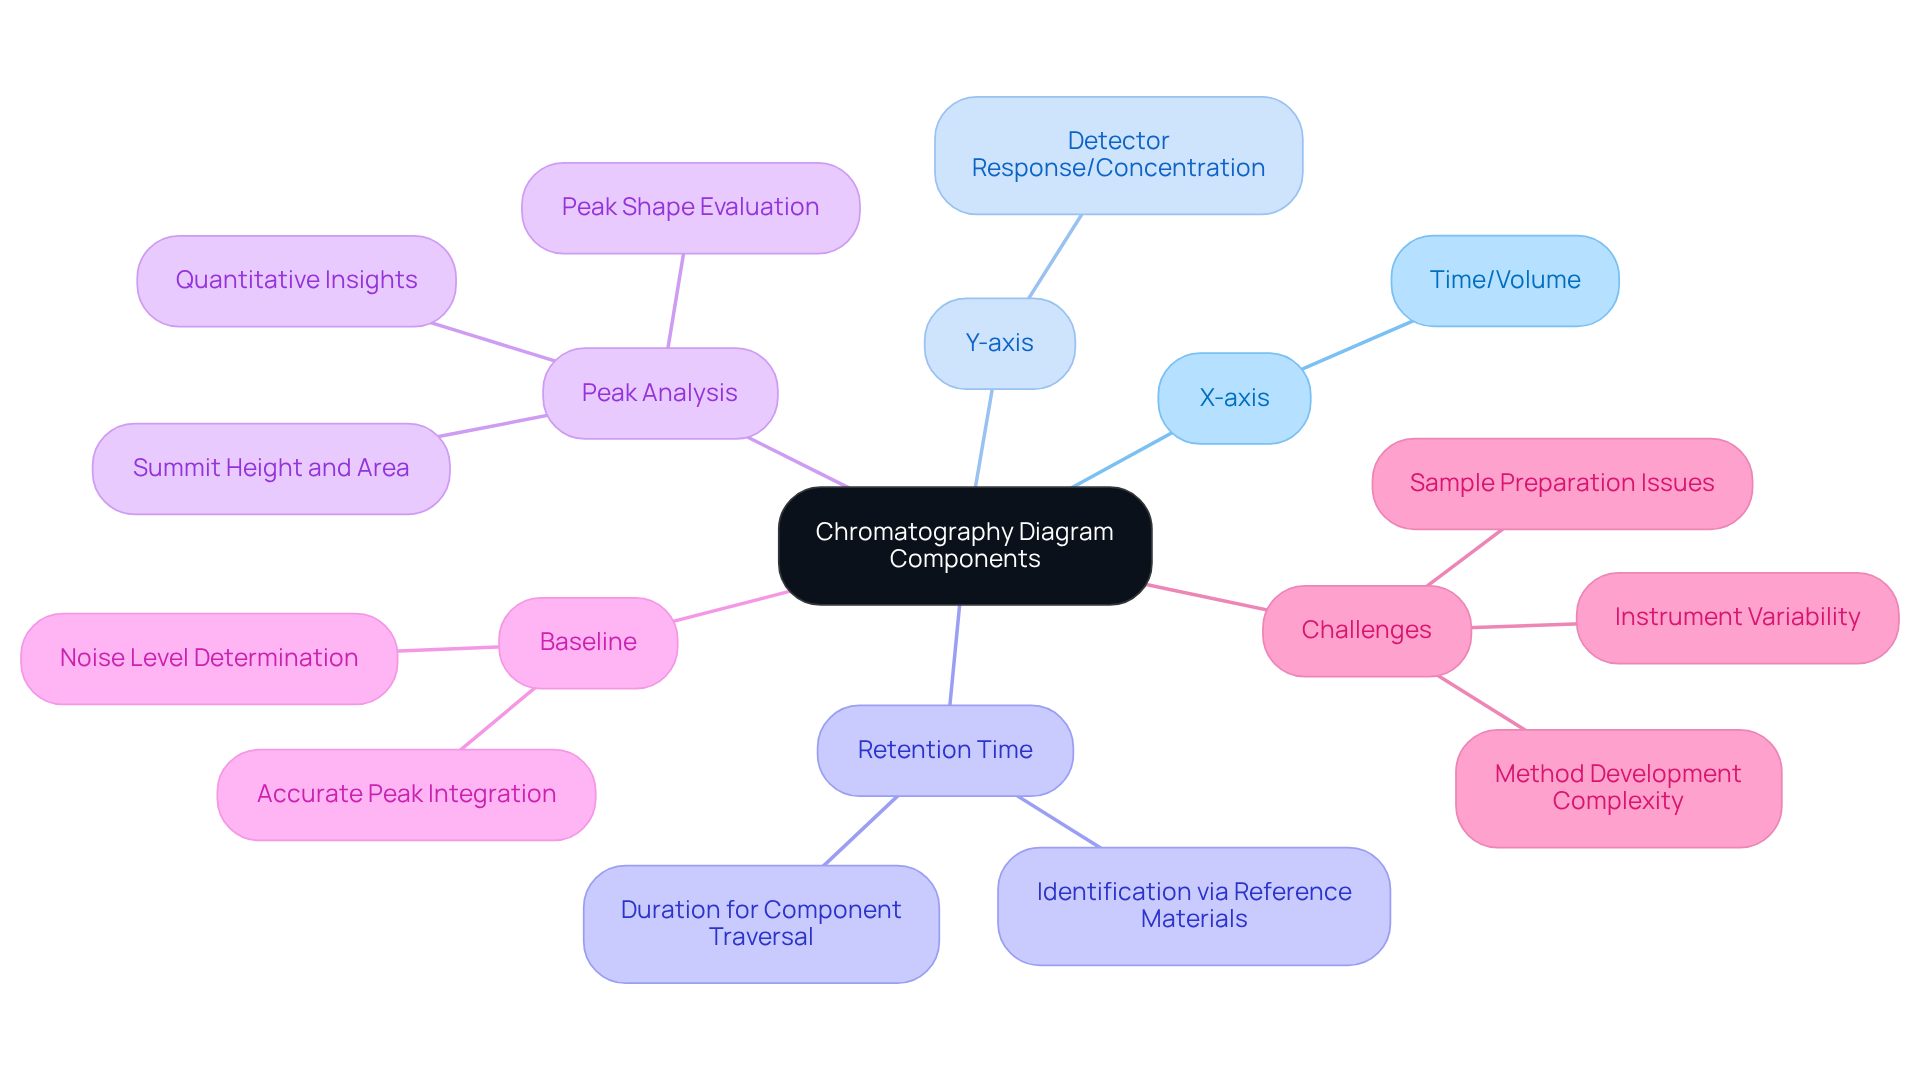
Key components of a chromatography diagram include the x-axis, which typically signifies time or the volume of the mobile phase, and the y-axis, indicating the detector response or concentration of the analytes. Each summit on the chromatogram corresponds to a specific element of the mixture, with the height and area of the summit providing quantitative insights regarding the concentration of that element.
Furthermore, retention time—the duration for a component to traverse the system—is a critical factor in substance identification. Compounds can be accurately identified by correlating retention time and signal shape with reference materials under identical conditions, facilitating reliable comparisons against known standards. Understanding these components is essential for accurately interpreting chromatographic results and creating a chromatography diagram to make informed decisions based on the data.
Statistics indicate that maximum area evaluation often proves more dependable than maximum height for measuring concentrations, particularly when peaks deviate from optimal forms. This underscores the importance of mastering top evaluation methods to enhance data interpretation and ensure precise outcomes in scientific research.
Moreover, chromatography is pivotal in isolating and purifying target compounds in drug discovery, underscoring its significance in pharmaceutical applications. Additionally, the baseline in chromatographic evaluation is crucial for determining noise levels and ensuring accurate peak integration.
Challenges such as method development complexity and sample preparation issues also affect chromatographic analysis, necessitating meticulous consideration in experimental design.

Conclusion
Chromatography diagrams, or chromatograms, serve as vital tools for visualizing the intricate separations that occur in mixtures throughout analytical processes. Their capacity to convert complex data into clear graphical representations empowers scientists to interpret sample compositions with precision. This comprehension is essential for ensuring accuracy and reliability across various applications, from pharmaceutical development to environmental testing.
The article illuminates several critical facets of chromatography diagrams, encompassing their definition, historical evolution, and fundamental components. It underscores the significance of these diagrams in analytical chemistry, highlighting their role in guaranteeing purity and adherence to safety standards. Furthermore, the advancement of chromatography techniques, coupled with the introduction of innovative methods, has augmented the utility of chromatograms, facilitating more precise analyses and informed decision-making within laboratory environments.
Ultimately, mastering chromatography diagrams transcends mere familiarity with their components; it involves recognizing their importance within the broader spectrum of scientific inquiry. As analytical techniques progress, the necessity for accurate and reliable chromatographic representations will undoubtedly intensify. Researchers are urged to deepen their understanding of these diagrams, ensuring they can fully leverage their potential to foster innovation and uphold quality across diverse fields.


